Member Services
Analytics Dashboards
PRISM’s Data and Analytics Dashboards are designed to help you get the most out of your data by offering a suite of interactive and intuitive dashboard applications. These applications are designed to be user-friendly, visualize your data with better clarity, and to provide you with data driven insights to better manage your risk. The Data and Analytics Dashboards are only accessible if your entity provides monthly loss data to PRISM (either directly or from your TPA) and you have reached out to PRISM’s Data and Analytics department to set up an account.
If you do not have an account, and your entity provides monthly data, and you would like access to the Data and Analytics Dashboards, please register for an account here.
PRISM offers the following dashboard applications:
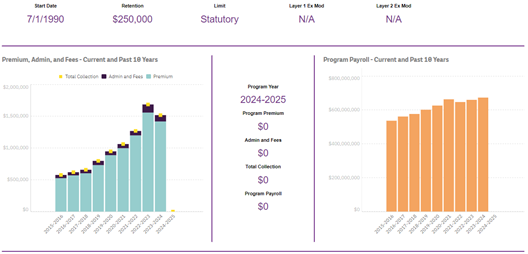
One-stop-shop for your PRISM membership information, top 10 claims reports, as well as by year high level analytics on: payroll history, claim financials and counts, key performance indicators (KPIs), and peer group benchmarking.
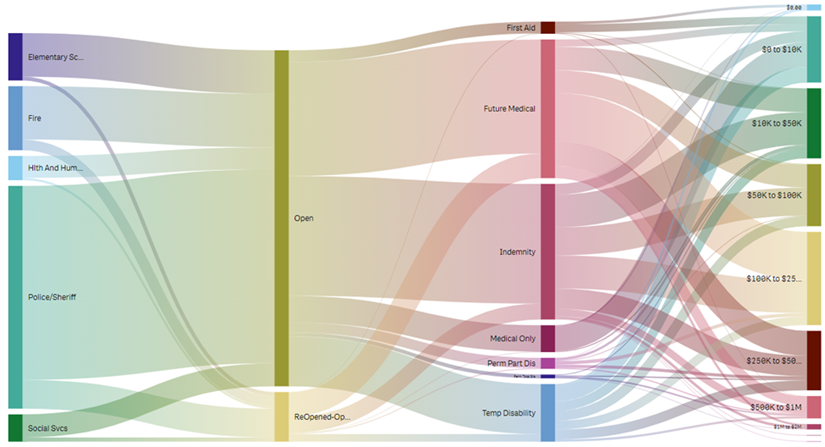
Split into separate Work Comp and Liability applications, our Loss Discovery applications provide Loss Flow and Loss Analysis capabilities letting you drill down and uncover your most significant loss drivers. With Loss Flow, you’ll see a high-level customizable visualization showing how various claim characteristics impact your financial losses, claim counts, and KPIs. After identifying the claim characteristic that you are interested in, the Loss Analysis sheet allows you to isolate that field and analyze it deeper by viewing it across time.
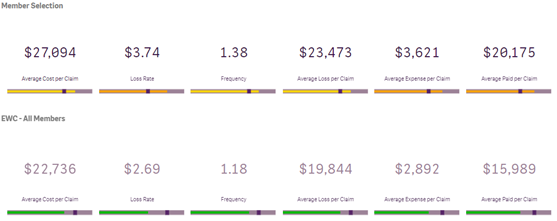
Allows you to compare your entity’s claim financials, counts, and KPIs to various peer group across customizable timelines. This allows you to see how your loss experience performs relative to the summary statistics of other relatable peer groups within PRISM’s membership.
Provides you with access to pull your own data that we collect from your data provider according to our loss data specification. You also have the ability to filter down and customize the exact data you are able to pull so you get exactly the right data you need without unnecessary fluff.
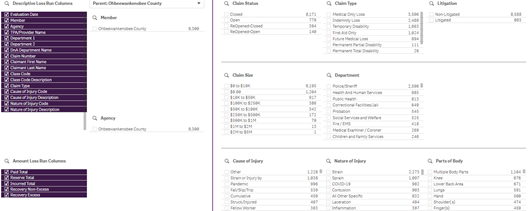
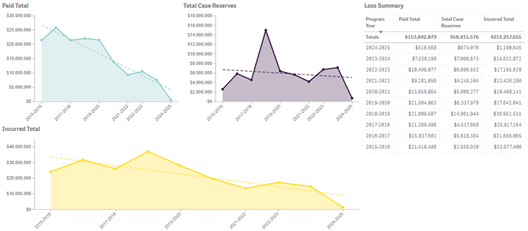
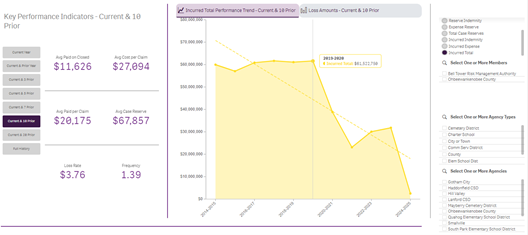
Analyzes and provides trends on your claim financials, counts, and KPIs across time. Let’s you see how different aspects of your loss history have changed over time.
Shows a summary of your membership in PRISM’s coverage programs, your actuarial study and claims audit service schedule, and details of your PRISM coverage program membership information across time (SIR, premium, and payroll history).
